The Impacts of El Niño and La Niña Phenomena on Land Surface Temperature Changes Due to Different Land Uses in Phrae Province
DOI:
https://doi.org/10.34044/tferj.2025.9.1.6250Keywords:
Land surface temperatures, land use, Landsat 8, El Niño, La NiñaAbstract
Background and Objectives: The outlines a study that investigates the variations in land surface temperature (LST) and land use in Phrae Province, Thailand, during two distinct climate events: The El Niño event in 2020 and the La Niña event in 2024. The study highlights the impact of climate change, including the increasing frequency of these events, on the environment and agriculture. It emphasizes the importance of geospatial technology in monitoring these changes and utilizing satellite imagery to understand land temperature trends for effective disaster prevention planning. The study begins by acknowledging the role of climate change, both natural and human-induced, in contributing to global warming and exacerbating the frequency of El Niño and La Niña events. These climate phenomena lead to severe weather changes that directly impact sectors such as agriculture, often resulting in natural disasters. The objective of this research is twofold: 1) Compare Land Surface Temperature (LST) Variations: The study aims to analyze and compare the variations in LST during two distinct periods, the El Niño event of 2020 and the La Niña event of 2024, within Phrae Province.2) Examine the Relationship between LST and Land Use Types: It seeks to explore how different types of land use—such as forest land, agricultural land, and urban areas—affect LST during these events.
Methodology: The methodology involves the use of Landsat 8 satellite imagery from both 2020 and 2024 to gather the data needed for the analysis. The images were processed in the following steps: 1) Composite Band Images: Landsat imagery was used to create composite band images, a process that allows the extraction of relevant data for analysis. 2) Supervised Classification: The images were classified using the Maximum Likelihood Classification algorithm. Training areas were designated to guide the classification, which aimed to categorize land use into three primary types: forest land, agricultural land, and urban/built-up land. 3) Land Surface Temperature (LST) Analysis: The next step was converting the satellite image’s Digital Number (DN) values into radiance, which were then translated into brightness temperature. To adjust for the surface emissivity, the brightness temperature was further refined to provide an accurate measure of LST. 4) Categorizing LST by Land Use Type: After deriving the LST values, the study categorized the temperature ranges according to the different land use types, helping to identify temperature patterns related to land use changes.
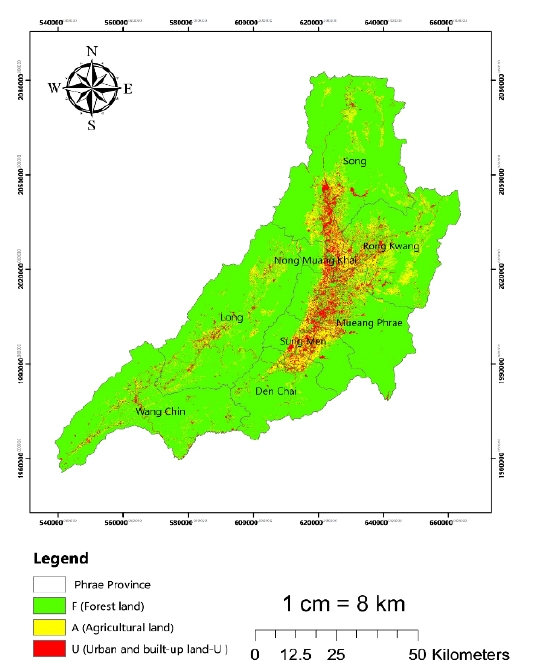
Main Results: The study presents several key findings related to both land use and LST: 1) land use classification (2020 vs. 2024): In 2020, forest land made up 66.3% of Phrae Province’s total land area, followed by agricultural land (25.7%) and urban/built-up areas (8%). By 2024, the land use pattern had changed slightly. Forest land decreased to 63.5%, while agricultural land increased to 26.9%, and urban/built-up land grew to 9.6%. 2) Land Surface Temperature (LST) Data (2020 and 2024) showed that in 2020, the highest recorded temperature was 44.2°C in March, and the lowest was 23.8°C in August. While, in 2024, the highest recorded temperature was 43.7°C in April, and the lowest was 24.2°C in August. The Monthly average temperature comparison between two events expressed that in 2020, the highest and lowest average temperature found in March (34°C) and August (10°C), respectively. While, in 2024, it was found in April (34°C) and August (10.8°C), respectively. The LST varied among land use types. In 2020, the average LST for forest areas was lowest (21.5°C) and followed by urban/built-up land (32.3°C) and agricultural land (36.2°C), respectively. While, in 2024, it still be found as the same trend as in 2022 but the forest areas shown increased LST (24.4°C), while agricultural land and urban/built-up areas experienced a slight decrease, 34.5°C and 32.3°C, respectively.
Conclusion: This study concludes that land surface temperature (LST) variations are significantly influenced by the El Niño and La Niña climate phenomena, with the effects modulated by land use type. Key findings reveal that: (1) During the El Niño event in 2020, agricultural and urban/built-up areas recorded elevated LSTs. This is likely attributable to the intensified heat and drier conditions commonly associated with El Niño episodes. (2) In contrast, during the La Niña event in 2024, forested areas exhibited comparatively higher LSTs than agricultural and urban zones. Although La Niña typically brings cooler and wetter weather, it can also produce localized temperature anomalies, particularly in dense forest regions with limited capacity for heat dissipation. The study underscores the crucial role of geospatial technologies in tracking and analyzing climate-induced variations in land use and surface temperatures. Such insights are essential for local governments and policymakers to design informed, spatially targeted strategies for disaster risk reduction and climate adaptation. This is especially pertinent in agriculturally reliant regions such as Phrae Province, where climate variability poses direct risks to livelihoods and food security. Moreover, the findings contribute to the expanding literature on climate-land interactions, emphasizing the complexity of climate impacts across different ecosystems. The application of satellite data in this context proves to be a powerful tool for environmental monitoring, enabling more accurate and timely assessments of climatic effects. Ultimately, this research advocates for enhanced integration of geospatial analysis in climate resilience planning, ensuring that both human and natural systems are better equipped to navigate future environmental challenges.
Downloads
References
Center for Climate Change Research Strategy. 2022. Climate change in Thailand. Available source: https://ccrc.nrct.go.th. (Accessed: December 7, 2024)
Copernicus Climate Change Service. 2024. Copernicus global temperature record streak continues – April 2024 was hottest on record. Available source: https://climate.copernicus.eu/copernicus-global-temperature-record-streak-continues-april-2024-was-hottest-record (Accessed: January 10, 2025)
Department of Disaster Prevention and Mitigation. 2015. Phrae Province 2015 Retrieved. Available source: https://www.disaster.go.th/upload/download/file_attach/5fad08994f96e.pdf6. (Accessed: January 10, 2025)
FAO. 2000. Manual of Data Analysis and Land Use Classification Using Land Cover Classification System of the Food and Agriculture Organization (FAO). Available source:http://www1.ldd.go.th/WEB_PSD/pdf/expert%20work/ex5/3-3.pdf. (Accessed: January 30, 2025)
Foody, G. M. 2020. Explaining the unsuitability of the kappa coefficient in the assessment and comparison of the accuracy of thematic maps obtained by image classification. Remote Sensing of Environment 239: 111630. https://doi.org/https://doi.org/10.1016/j.rse.2019.111630 DOI: https://doi.org/10.1016/j.rse.2019.111630
GISTDA. 2020. Surface temperature analysis using satellite imagery for assessing extreme heat conditions in Thailand. Geo-Informatics and Space Technology Development. Available source: https://www.gistda.or.th. (Accessed: December 7, 2024)
Hydro–Informatic Institute (Public Organization) (HII). 2006. Flood event record in Northern Thailand. Available source: https://tiwrm.hii.or.th/current/FloodNorth_May49.html?utm_source=chatgpt. Com. (Accessed: January 10, 2025)
Imhoff, M. L., Zhang, P., Wolfe, R. E., & Bounoua, L. 2010. Remote sensing of the urban heat island effect across biomes in the continental USA. Remote Sensing of Environment, 114(3):504-513.https://doi.org/https://doi.org/10.1016/j.rse.2009.10.008 DOI: https://doi.org/10.1016/j.rse.2009.10.008
IPCC. 2023. Synthesis report for policy makers. Available source: https://www.ipcc.ch/assessmentreport/ar3. (Accessed: January 10, 2025)
Lal, R. 2004. Soil carbon sequestration to mitigate climate change. Geoderma 123(1–2): 1–22. https://doi.org/10.1016/j.geoderma.2004.01.032 DOI: https://doi.org/10.1016/j.geoderma.2004.01.032
Lehmann, J., Robinson, A., Barriopedro, D., Rahmstorf, S. & Coumou, D. 2021. Increasing heat and rainfall extremes now far outside the historical climate. NPJ Climate and Atmospheric Science 4: 45. https://doi.org/10.1038/s41612-021-00202-w DOI: https://doi.org/10.1038/s41612-021-00202-w
Mokkprakorn, M. & T. Chaiyakham. 2023. Estimating land surface temperature in the northeastern region using multi-temporal satellite imagery. Burapha Science Journal 28(1): 136-154. (in Thai)
Marod, D., S. Thinkampheang, W. Phumphuang, A. Yarnvudhi, J. Thongsawi, P. Kachina, T. Nakashizuka, H. Kurokawa & S. Hermhuk. 2025. Relationship Between Climate Changes and Forest Dynamics Along Altitudinal Gradients at Doi Suthep-Pui National Park, Northern Thailand. Forests 16(1): 114. https://doi.org/10.3390/f16010114 DOI: https://doi.org/10.3390/f16010114
Nalder, I. A. & R. W. Wein. 1998. Spatial interpolation of climatic normals: Test of a new method in the Canadian boreal forest. Agricultural and Forest Meteorology 92(4): 211–225. https://doi.org/10.1016/S0168-1923(98)00102-6 DOI: https://doi.org/10.1016/S0168-1923(98)00102-6
National Oceanic & Atmospheric Administration. 2016. El Niño and La Niña: Frequently asked questions. Available source : https://www.climate.gov/news-features/understanding-climate/el-ni%C3%B1o-and-la-ni%C3%B1a-frequently-asked-questions. (Accessed: January 10, 2025).
Oke, T. R. 1982. The energetic basis of the urban heat island. Quarterly Journal of the Royal Meteorological Society 108(455): 1-24. DOI: https://doi.org/10.1002/qj.49710845502
Phengphit, N., S. Karnchanasutham, K. Nualchawee & P. Soytong. 2017. The Study of Correlation Between Land Surface Temperature with Urban and Building Area, A Case Study of Amphoe Mueang Rayong, Rayong Province, Thailand. Journal of Geoinformation Technology of Burapha University 2(3): 27-40. (in Thai)
Sun, D. & R. T. Pinker. 2003. Estimation of land surface temperature from a Geostationary Operational Environmental Satellite (GOES-8). Journal of Geophysical Research: Atmospheres 108:4326. doi:10.1029/2002JD002422, D11.Thai Meteorological Department. 2024. La Niña phenomenon. Available source: https://www.tmd.go.th. (Accessed: January 30, 2025) DOI: https://doi.org/10.1029/2002JD002422
Thinkampheang, S., T. Nakashizuka, W. Suksavate, P. Kachina, S. Hermhuk, L. Asanok, W. Phumphuang, B. Chouibumroong, J. Wu, H. Kurokawa. & D. Marod. 2024. Impacts of climate change on forest restoration dynamics in the lower montane forest of Doi Suthep-Pui National Park,Northern Thailand. Biodiversitas 25(12): 4829-4845. https://smujo.id/biodiv/article/view/19618/8230 DOI: https://doi.org/10.13057/biodiv/d251219
Trenberth, K. E., J. T. Fasullo, & T. G. Shepherd. 2015. Attribution of climate extreme events. Nature Climate Change 5(8): 725-730. https://doi.org/10.1038/nclimate2657 DOI: https://doi.org/10.1038/nclimate2657
U.S. Geological Survey (USGS). 2019. Landsat 8 data users handbook (version 1.0). U.S. Department of the Interior. Available source: https://www.usgs.gov/centers/eros/science/landsat (Accessed: January 30, 2025)
Downloads
Published
Issue
Section