ANALYSIS OF THE LACTATION CURVE MODELS FOR PREDICTING FL305DMY IN JAFARABADI BUFFALOES
DOI:
https://doi.org/10.56825/bufbu.2025.4445841Keywords:
Bubalus bubalis, buffaloes, Jafarabadi, parabolic exponential function (PEF) , inverse polynomial function (IPF), gamma type function (GF), Mixed log function (MLF)Abstract
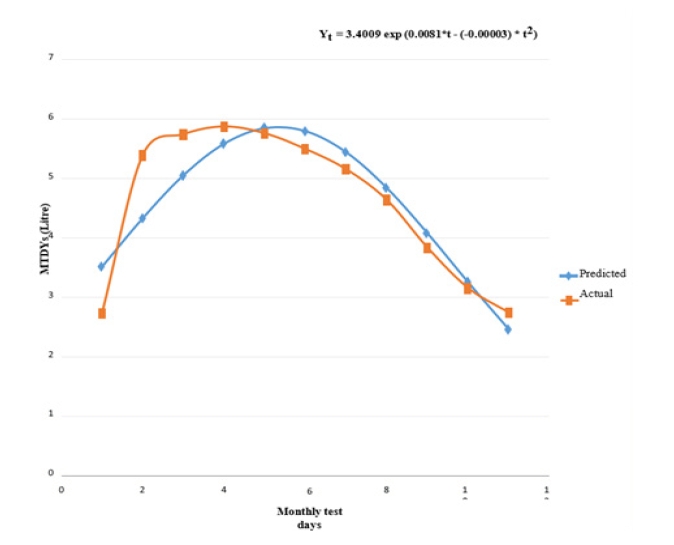
The present investigation was conducted on first lactation production traits of 213 Jafarabadi buffaloes spread over a period of 24 years (1991 to 2014), maintained at Cattle Breeding Farm, Kamdhenu University, Junagadh. The objectives of the study were to find the best fit of lactation curve model which can describe the first lactation curve in Jafarabadi buffalo and to examine the curve pattern of first lactation yield using MTDYs in Jafarabadi buffalo. Four different lactation curve models viz. Parabolic Exponential Function (PEF), Inverse Polynomial Function (IPF), Gamma Type Function (GF) and mixed Log Function (MLF) were used for predicting FL305DMY using MTDMY. The coefficient of determination (R2 -value) for PEF, IPF, GF and MLF were 83.28%, 98.84%, 96.80%, and 92.73%, respectively. The average root mean square error (RMSE) was found to be minimum for GF (0.073 litre) followed by PEF (0.149 litre), MLF (0.102 litre) and IPF (0.376 litre). Graphical presentation indicated that GF was found to be best fit for MTDYs in Jafarabadi buffalo, while PEF was least fitted. The trend of GF indicated that this function was most suitable to Jafarabadi buffaloes.
Downloads
Metrics
References
Anonymous. 2013. Annual Report 2012-2013, Department of Animal Husbandry, Dairying and Fisheries, Government of India, India.
Appannayar, M.M. and S. Kumar. 1997. First lactation curve in Surti buffaloes with test day model. Karnataka Journal of Agricultural Sciences, 10(1): 277-279.
Barbosa, S.B.P., R.G.A. Pereira, K.R. Santoro, A.M.V. Batistal and A.C.R. Neto. 2007. Lactation curve of cross-bred buffalo under two production systems in the Amazonian region of Brazil. Ital. J. Anim. Sci., 6(Suppl. 2): 1075-1078. DOI: https://doi.org/10.4081/ijas.2007.s2.1075 DOI: https://doi.org/10.4081/ijas.2007.s2.1075
Bhat, P.N. and R. Kumar. 1980. Comparative efficiency of various mathematical functions on adjusted lactation curve in Indian buffaloes. Indian J. Dairy Sci., 33: 408-409.
Brody, S. A.C. Ragsdale and C.W. Turner. 1923. The rate of decline of milk secretion with the advance of the period of lactation. J. Gen. Physiol., 5(4): 441-444. DOI: https://doi.org/10.1085/jgp.5.4.441 DOI: https://doi.org/10.1085/jgp.5.4.441
BAHS. 2023. Basic Animal Husbandry and Fisheries Statistics, Department of Animal Husbandry, Dairying and Fisheries, Ministry of Agriculture and Farmers Welfare, Government of India, India.
Cheema, J.S. and S.B. 1983. Lactation curve in Murrah buffaloes. Indian Vet. J., 60(8): 637-642.
Cunha, D.N.F.V., J.C. Pereira, F.F. Silva, O.F. Campos, J.L. Braga and J.A. Martuscello. 2010. Selection of models of lactation curves to use in milk production simulation systems. Revista Brasileira de Zootecnia, 39(4): 891 902. DOI: https://doi.org/10.1590/S1516-35982010000400026 DOI: https://doi.org/10.1590/S1516-35982010000400026
Dematawewa, C.M. and J.C.M. Dekkers. 2014. Lactation curve modeling for Murrah and Surti buffalo breeds in Sri Lanka. In Proceedings, 10th World Congress of Genetics Applied to Livestock Production, Peradeniya, Sri Lanka.
Dongre, V.B. 2012. Modeling lactation curve for sire evaluation in Sahiwal cattle. Ph.D. Thesis, National Dairy Research Institute (Deemed University), Karnal, Haryana, India.
Dimauro, C., G. Catillo, N. Bacciu and N.P.P. Macciotta. 2005. Fit of different linear models to the lactation curve of Italian water buffalo. Ital. J. Anim. Sci., 4(Suppl. 2): 22-24. DOI: https://doi.org/10.4081/ijas.2005.2s.22 DOI: https://doi.org/10.4081/ijas.2005.2s.22
Guo, Z. and H.H. Swalve. 1995a. Modelling of the lactation curve as a sub-model in the evaluation of test day records. In Proceeding to Interbull Meeting, Uppsala, Sweden.
Keown, J.F., R.W. Everett, N.B. Empet and L.H. Wadell. 1986. Lactation curves. J. Dairy Sci., 69(3): 769-781. DOI: https://doi.org/10.3168/jds.S0022-0302(86)80466-0 DOI: https://doi.org/10.3168/jds.S0022-0302(86)80466-0
Kocak, O. and B. Ekiz. 2008. Comparison of different lactation curve models in Holstein cows raised on a farm in the south-eastern Anatolia region. Arch. Anim. Breed., 51(4): 329-337. DOI: https://doi.org/10.5194/aab-51-329-2008 DOI: https://doi.org/10.5194/aab-51-329-2008
Nelder, J.A. 1966. Inverse polynomials, A useful group of multifactor response functions. Biometrics, 22: 128-141. DOI: https://doi.org/10.2307/2528220
Olori, V.E., S. Brotherstone, W.G. Hill and B.J. McGuirk. 1999. Fit of standard models of the lactation curve to weekly records of milk production of cows in a single herd. Livest. Prod. Sci., 58(1): 55-63. DOI: https://doi.org/10.1016/S0301-6226(98)00194-8 DOI: https://doi.org/10.1016/S0301-6226(98)00194-8
Şahin, A., Z. Ulutaş, A. Yildirim, Y. Aksoy and S. Genç. 2014. Anadolu Mandalarında Farklı Laktasyon Eğrisi Modellerinin Karşılaştırılması. Kafkas. Üniv. Vet. Fak. Derg., 20(6): 847-855.
Şahin, A., Z. Ulutaş, A. Yildirim, Y. Aksoy and S. Genç. 2015. Lactation curve and persistency of Anatolian buffaloes. Ital. J. Anim. Sci., 14: 150-157. DOI: https://doi.org/10.4081/ijas.2015.3679 DOI: https://doi.org/10.4081/ijas.2015.3679
Sahoo, S.K., A. Singh, A.K. Gupta, A.K. Chakravarty, G.S. Ambhore and S.K. Dash. 2015. Comparative evaluation of different lactation curve functions for prediction of bi-MTDYs in Murrah buffaloes. Anim. Sci., 9(3): 89-94.
Sahoo, S.K., A. Singh, A.K. Gupta, A.K. Chakravarty, G.S. Ambhore and M. Singh. 2016. Comparison of four different lactation curve models for prediction of weekly test day milk yields in Murrah buffalos. Indian J. Anim. Sci., 86(1): 101-103. DOI: https://doi.org/10.56093/ijans.v86i1.55043
Sahoo, S.K., A. Singh, P.R. Shivahre, M. Singh, S. Dash and S.K. Dash. 2014b. Prediction of fortnightly test-day milk yields using four different lactation curve models in Indian Murrah buffalo. Adv. Anim. Vet. Sci., 2(12): 647-651. DOI: https://doi.org/10.14737/journal.aavs/2014/2.12.645.649 DOI: https://doi.org/10.14737/journal.aavs/2014/2.12.647.651
Singh, M., A. Singh, A.K. Gupta, S.K. Dash, A. Gupta, S.K. Sahoo, S. Dash and P.R. Shivahre. 2015. Comparative evaluation of different lactation curve models in prediction of monthly test-day milk yields in Murrah buffaloes. J. Anim. Res., 5(1): 189-193. Available on: https://ndpublisher.in/admin/issues/JARV5N15.pdf DOI: https://doi.org/10.5958/2277-940X.2015.00030.3
Soysal, M.I., E.K. Gürcan and M. Aksel. 2015. The comparison of lactation curve with different models in Anatolian water buffalo. poster presentation, In 7th Balkan Conference on Animal Science, Sarajevo/Bosnia Herzegovina, Turkey.
Sikka, L.C. 1950. A study of lactation as affected by lactation and environment. J. Dairy Res., 17: 231-252. DOI: https://doi.org/10.1017/S0022029900005811
Wood, P.D.P. 1967. Algebraic model of the lactation curve in cattle. Nature, 216: 164 16 DOI: https://doi.org/10.1038/216164a0
Downloads
Published
How to Cite
Issue
Section
License
Copyright (c) 2025 Buffalo Bulletin

This work is licensed under a Creative Commons Attribution-NonCommercial-NoDerivatives 4.0 International License.